Overview
Debugging is an essential skill for developers, and using a debugger can make finding and fixing bugs much faster and more efficient. In this guide, we will cover how to use a debugger in your development environment, walk through some basic functionality, and provide real-life examples for common debugging scenarios.
What is a Debugger?
A debugger is a tool that allows you to inspect and control the execution of your code. It provides features like setting breakpoints, inspecting variables, stepping through code line by line, and analyzing the program’s flow.
By using a debugger, developers can:
- Pause the execution of code at specific points (breakpoints)
- Examine variables and objects to understand their values
- Step through code one line at a time to understand the flow
- Diagnose performance issues or logical errors
How to Use the Debugger in the Browser (Chrome DevTools)
When debugging JavaScript in the browser, Chrome DevTools provides a powerful suite of tools to inspect, control, and step through your code. In this guide, we’ll explain each debugging step in detail, and then walk you through a hands-on example that includes asynchronous code (e.g., using setTimeout or fetch). This example will allow you to visually see how stepping through code works in real-time, including asynchronous behavior.
Understanding DevTools Debugging Features
Before diving into the code example, let’s familiarize you with some key debugging features that will be useful:
Breakpoints
A breakpoint pauses your code execution at a specific point so you can inspect values, variables, and the call stack. Breakpoints are set by clicking on the line number in the Sources tab.
Stepping Through Code
Once the code hits a breakpoint, you can move through the code using several buttons:

Resume (▶️)
- Action: Resumes code execution after it has been paused at a breakpoint.
- Use Case: After hitting a breakpoint, click this to allow the program to continue running until the next breakpoint or until the script finishes executing.
Step Over (⬇️)
- Action: Executes the current line of code and moves to the next line.
- Use Case: If the current line of code is a function call, this button will execute the function but will not step inside it. It will move to the next line after the function call.
- Example: If you’re inside a function and want to skip stepping into another function within that line, you use this button.
Step Into (⬇️)
- Action: If the current line of code contains a function call, this button will take you into the function to debug further.
- Use Case: When you want to debug a function that is being called in the current line of code, click this button to step inside the function and inspect its execution.
Step Out (⏏️)
- Action: Once inside a function, this button will allow you to exit that function and return to the calling code.
- Use Case: If you’re inside a function and want to finish execution of that function and return to the code that called it, click this button.
Step (↕️)
- Action: This button lets you step through the current line of code, including stepping into any async calls or callbacks, so you can track the code execution flow in finer detail
- Use Case: When you want to break into each step of the code (including async code) to observe how things are executing line by line.
Disable Breakpoint (⛔)
- Action: Disables all breakpoints in the current script without removing them.
- Use Case: If you no longer want the script to pause at any breakpoints during this session but want to keep them in place for later debugging, click this button to temporarily disable all breakpoints.
Other Helpful Features
- Resuming Execution: After pausing at a breakpoint, you can use the Resume button to continue code execution until the next breakpoint or until the script ends.
- Async Callbacks: Handling asynchronous code (like
setTimeout, Promises, orfetch) in debugging requires special attention, as the code doesn’t run sequentially. You’ll need to handle execution flow across multiple time-based or event-based callbacks. - Watch Expressions: You can add specific expressions (like
user.name) to watch and monitor as you step through the code. - Scopes: This panel shows the current local variables and their values. For debugging complex code, it’s essential to monitor variable values as you step through.
Step-by-Step Debugging Process Overview
1. Open DevTools and the Sources Tab
- Right-click on the page and select Inspect, or press
Ctrl+Shift+I(Windows/Linux) orCmd+Option+I(Mac) to open DevTools. - Navigate to the Sources tab.
2. Set a Breakpoint
- In the Sources tab, find the script you want to debug (this might be a
.jsfile or an inline script). - Click on the line number where you want to add the breakpoint.
3. Inspect Variables
- When the code execution pauses at the breakpoint, use the Scope section to inspect variables and their values.
4. Step Through the Code
- Use the Step Over, Step Into, and Step Out buttons to navigate through the code and observe the flow of execution.
5. Handle Asynchronous Code
- If the code contains asynchronous operations (e.g.,
setTimeout,fetch), watch how the execution flows when these operations complete.
6. Resume Code Execution
- After inspecting the code, use the Resume button to let the code continue execution.
Example Code with Asynchronous Operations
Here’s a more useful example that includes both synchronous and asynchronous operations. You can use this code to watch how stepping through and inspecting variables works, especially when asynchronous operations (like setTimeout) are involved.
function fetchData(callback) {
  setTimeout(() => {
    console.log("Data fetched!");
    callback("Fetched Data");
  }, 2000);
}

function processData(data) {
  console.log("Processing data:", data);
}

function main() {
  console.log("Starting to fetch data...");

  fetchData((data) => {
    processData(data);
  });

  console.log("Fetching data initiated...");
}

main();
Explanation of the Example Code
fetchData(): This function simulates an asynchronous operation, like fetching data from a server, usingsetTimeout. It takes a callback and, after 2 seconds, calls the callback with a string (“Fetched Data”).processData(): This function processes the data fetched byfetchData. It simply logs the data to the console.main(): This function is the entry point. It callsfetchDatato fetch the data, then proceeds to initiate the fetching process while still logging a message. The asynchronous nature means “Fetching data initiated…” will be logged immediately, but the data processing will be delayed by 2 seconds.
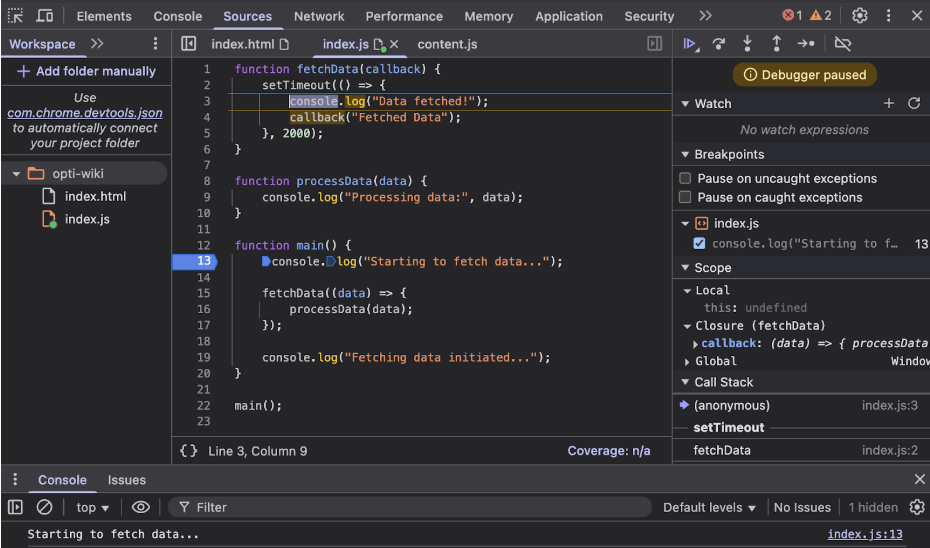
Step-by-Step Debugging Walkthrough
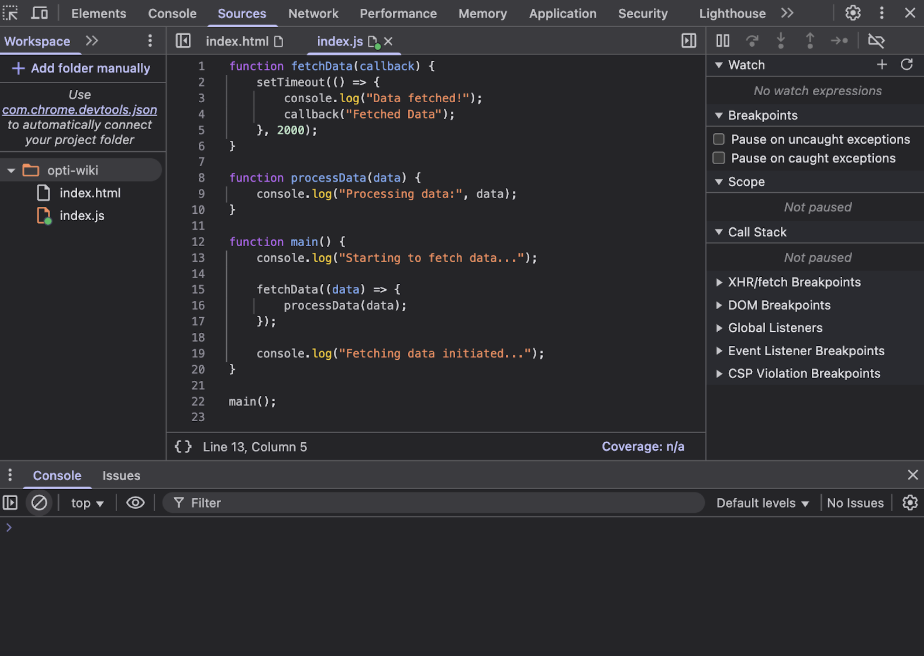
1. Set a Breakpoint in main()
-
Open DevTools and go to the Sources tab.
-
In the File Navigator, locate the script containing the
main()function. -
Set a breakpoint on the first line of the
main()function (console.log("Starting to fetch data...");).
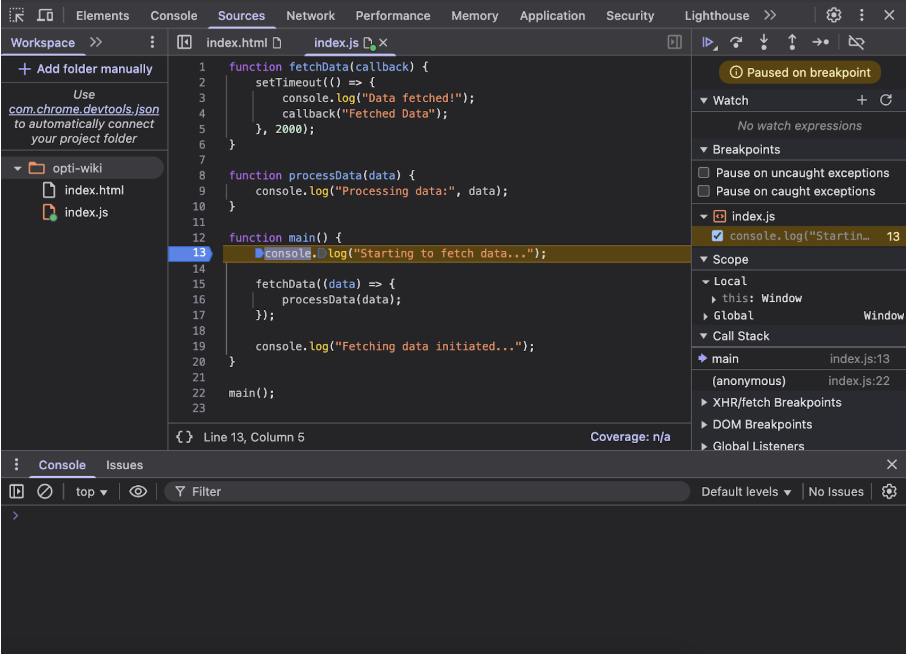
2. Reload the Page and Hit the Breakpoint
-
Reload the page to start running the code.
-
DevTools will pause at the breakpoint in
main(). The Code Viewer will highlight the paused line in yellow.
3. Step Over the Synchronous Code
-
Now, use Step Over (the arrow pointing over) to move through the synchronous code.
-
Click Step Over. The
console.log("Starting to fetch data...")will execute, and you’ll see this message in the browser’s console. -
Use Step Over again to move past the
fetchData()call and continue toconsole.log("Fetching data initiated...").
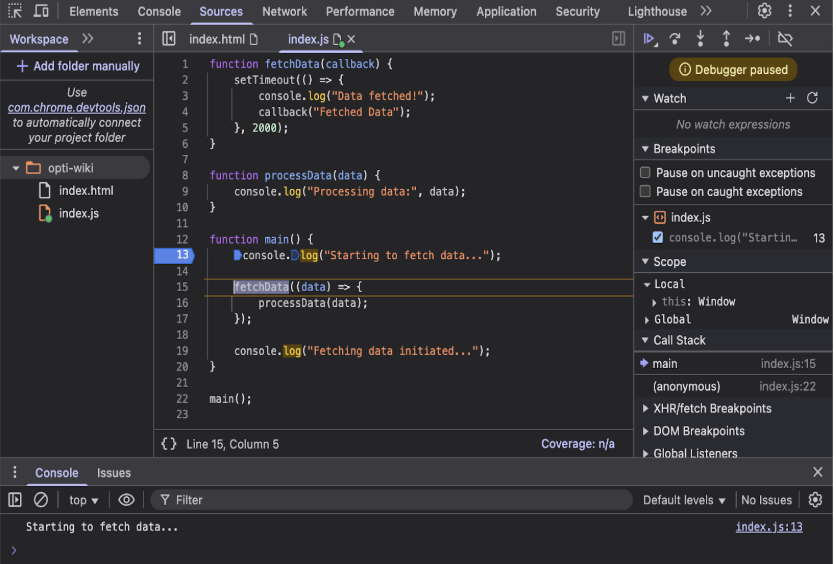
- Notice that this message is logged immediately, without waiting for the asynchronous operation to complete.
-
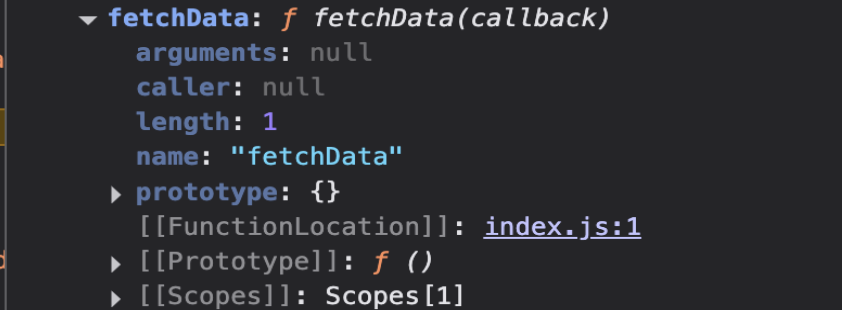
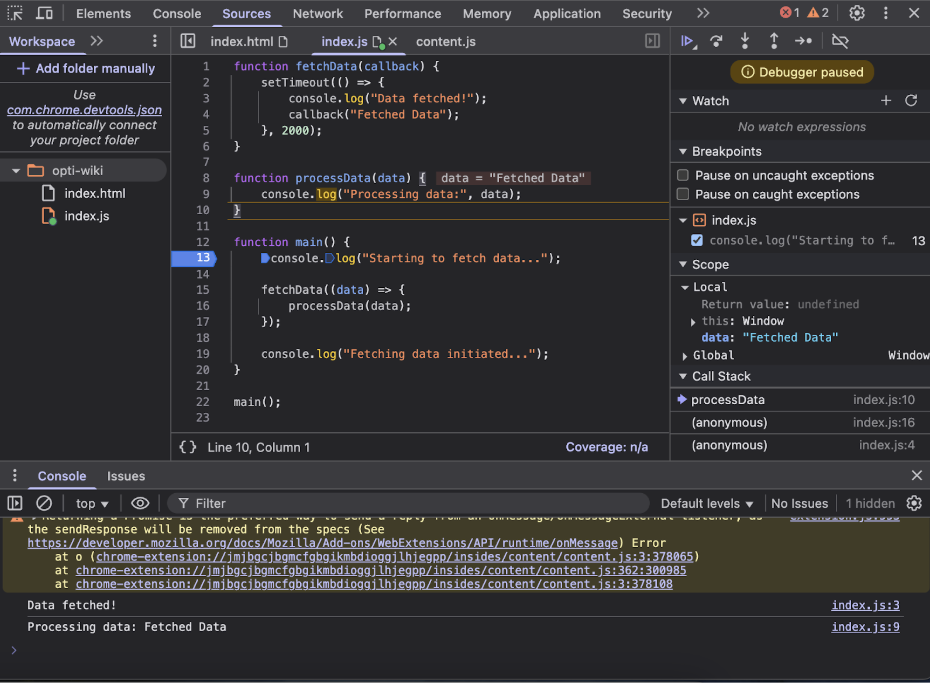
4. Inspect the Call Stack and Variables
- Check the Scope panel to see the current variables. The
datavariable won’t be set yet because the callback hasn’t run. You will see thatcallbackis a function reference, but no data has been passed yet.
5. Step Into Asynchronous Code (setTimeout)
-
Now, let’s focus on the asynchronous behavior. The
setTimeoutfunction infetchData()is delayed by 2 seconds. -
Click Step Into when you’re on the
fetchDataline. This will take you inside thesetTimeoutfunction. -
After 2 seconds, the callback will be invoked. The debugger will pause again at the callback function. Now you can inspect the data passed to
processData(). The value “Fetched Data” will appear in the Scope.
6. Step Over Inside the Callback
-
After the callback runs, you can use Step Over to move to the next line, which will call
processData(data). -
The
console.log("Processing data:", data)will be executed, showing the fetched data in the console.
7. Resume Execution
- Click Resume to let the script continue running. The rest of the code will execute normally, and you’ll see all the console logs and data being processed.