Debugging
Debugging is a structured process of finding the issues with the code and fixing them. All modern browsers support debugging tools and allow you to execute your code step by step to understand the code in the runtime.
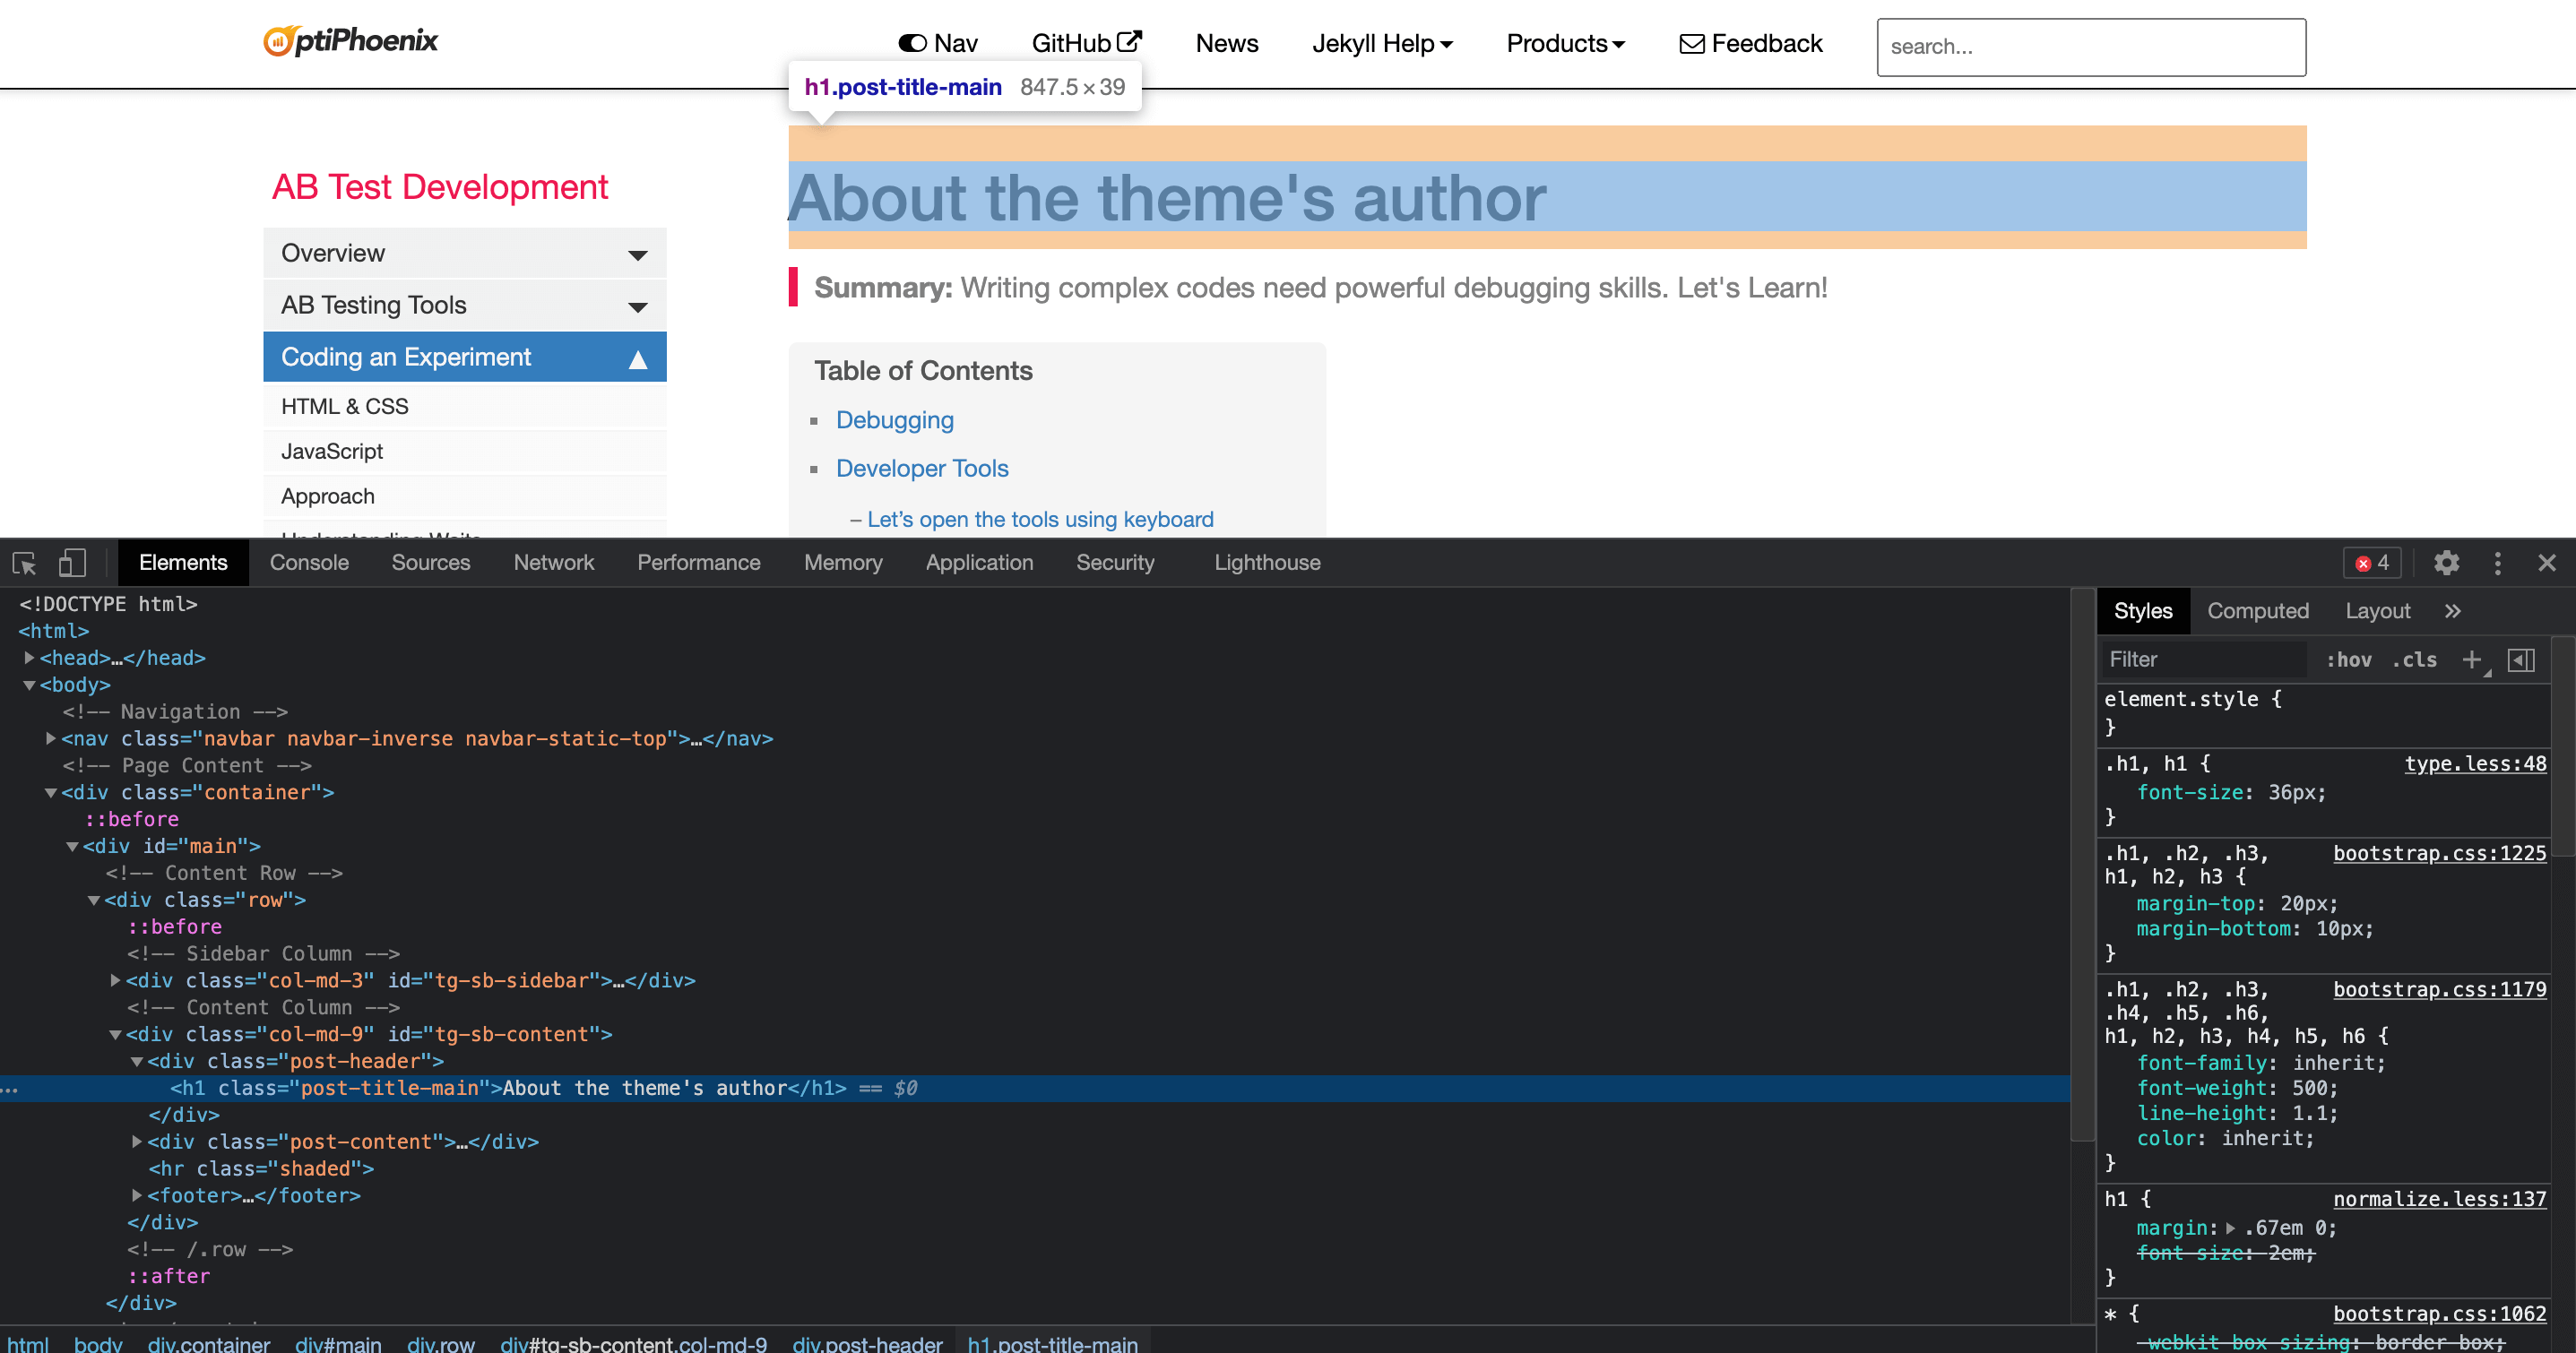
Developer Tools
Developer tools can give you access to the entire frontend code and functionality of the website such as CSS markups, JS errors, network requests etc.
Let’s open the tools using keyboard shortcuts
Chrome:
Cmd+Opt+Ion Mac andCtrl+Shift+Ion Windows systems
Safari:
Cmd+Opt+I
Firefox:
Ctrl+Shift+I/Cmd+Opt+I
Inside Dev tools: At a glance
Elements: The HTML DOM Tree and the CSS Properties on the right.
Console: Allows to view console logs, errors and try our the code.
Sources: Contains all the content of the website like JS, CSS files or Images. You can open a new file using
cmd+P.
Network: Allows us to monitor all incoming and outgoing HTTP, XHR requests.
Performance: Allows to monitor the performance of the website.
Application: It gives the ability to check the browser storages like cookies, localStorage and sessionStorage.
Inspect Elements
Test Responsive Views
Manipulate HTML and play with CSS
Debug Javascript: Breakpoints, Call Stack and Runtime execution
To use Javascript debugger, go to the Sources tab and open the JS file.
Pro tip: While developing insert a debugger statement debugger in the code to pause the execution.